Checking GPU usage statistics in Windows 11 is something every PC user should know, whether running games, editing videos, or diagnosing performance slowdowns. Knowing exactly how hard the GPU is working helps spot bottlenecks, verify hardware health, and get the most out of the system. This guide covers the fastest and most reliable methods to do exactly that.
Quick Summary
- Task Manager in Windows 11 shows real-time GPU utilisation, dedicated VRAM usage, shared memory, temperature, and per-engine load (3D, Copy, Video Encode, Video Decode) – no extra software needed.
- Task Manager labels the GPU as ‘GPU 0’ in the left panel – click it to see the full statistics view.
- GPU-Z provides deeper statistics including clock speeds, voltage, and per-engine sensor graphs with logging support.
- MSI Afterburner is the best option for on-screen overlay monitoring while gaming or running apps.
- All three methods are free and work on Windows 11.
Method 1: Check GPU Usage Using Task Manager
Task Manager is the quickest way to check GPU usage in Windows 11. It sits right inside the operating system, so there is nothing to install. Most people find this method more than enough for a quick check.
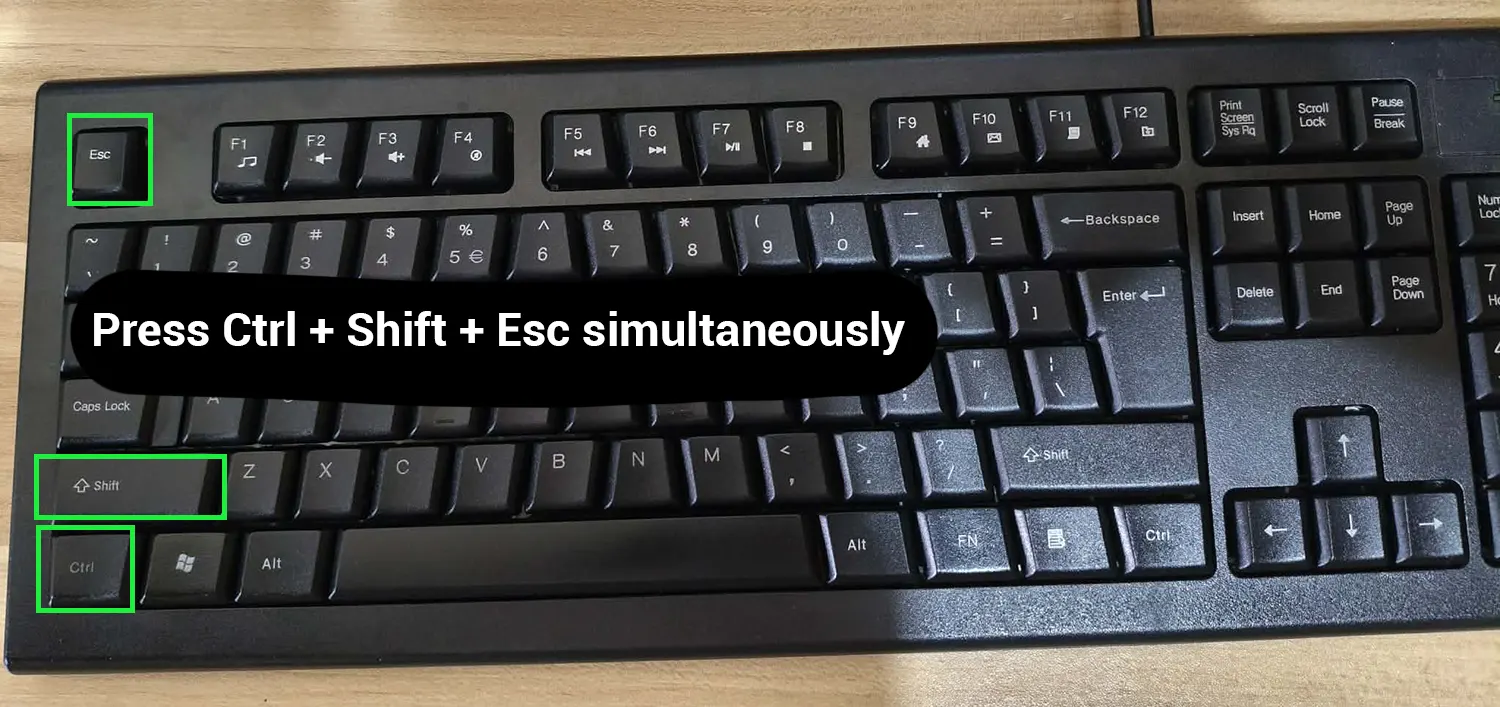
- Step 1: Right-click the taskbar at the bottom of the screen and select ‘Task Manager’ from the menu. Alternatively, press Ctrl + Shift + Esc on the keyboard.
- Step 2: Click the ‘Performance’ tab on the left side of the Task Manager window.
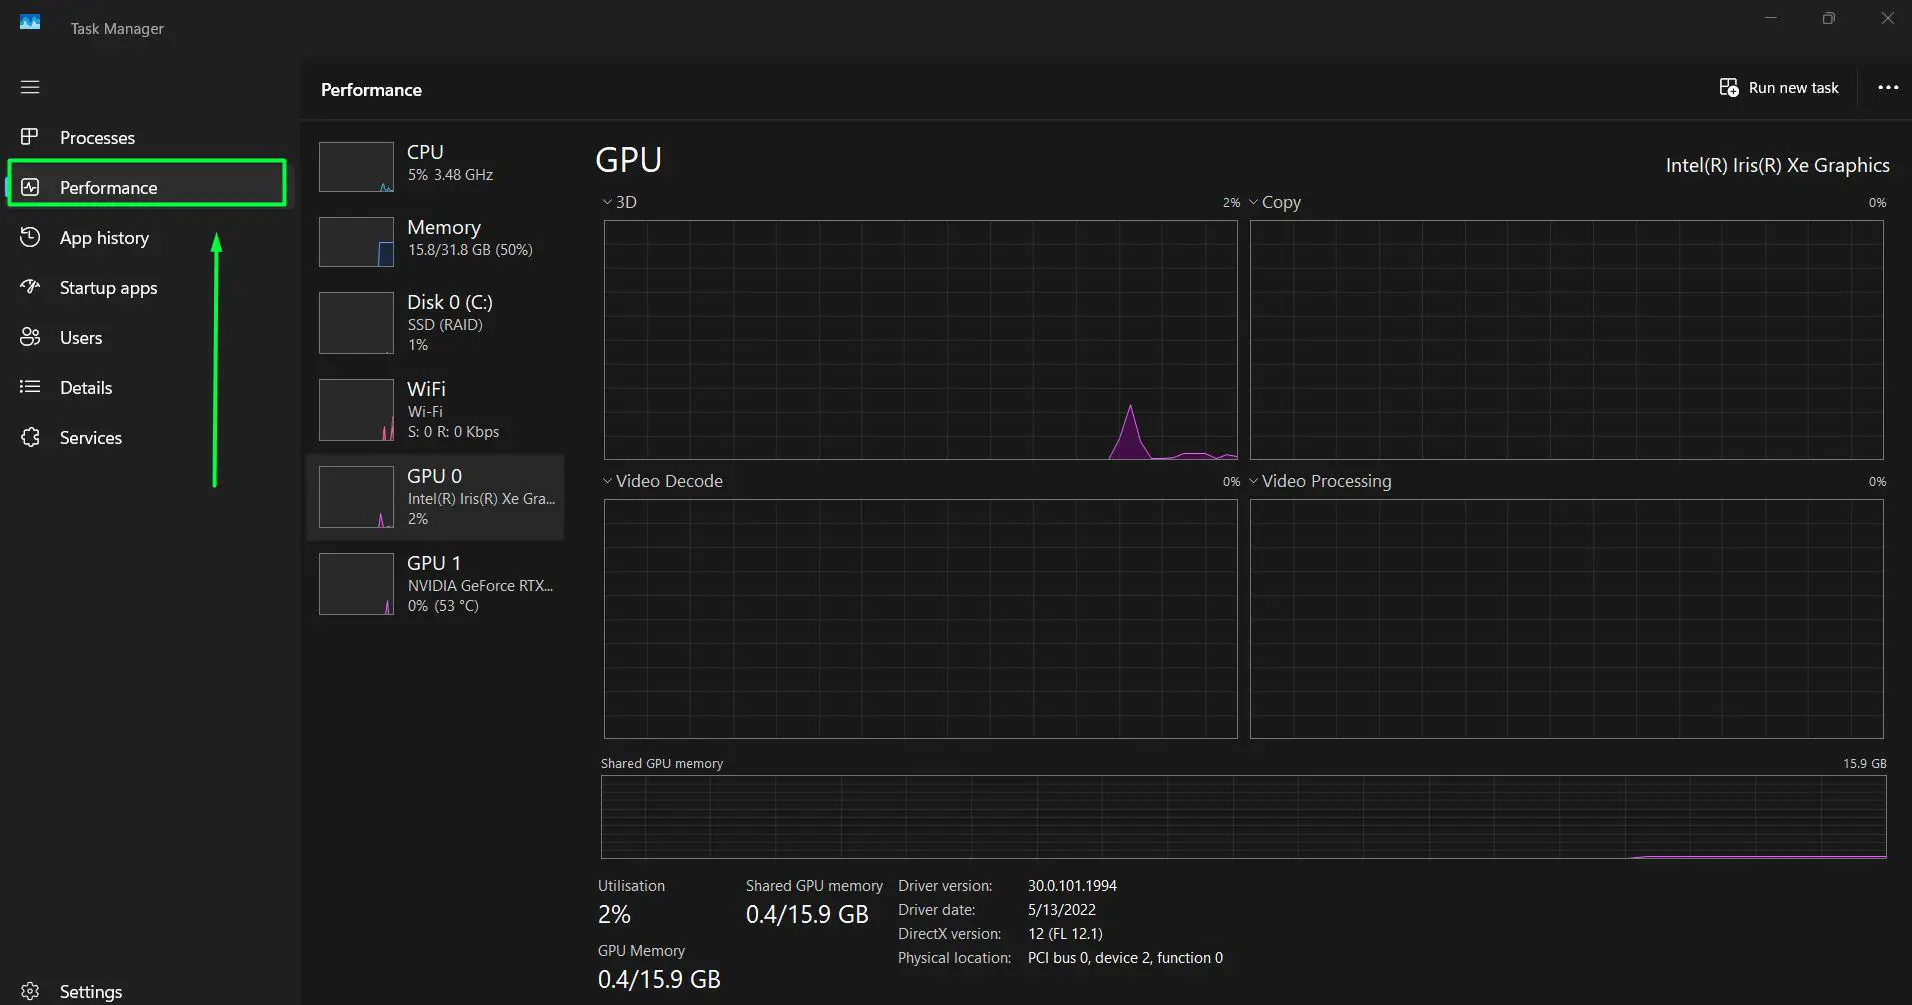
- Step 3: Look at the left panel and scroll down until the GPU section appears. Click on ‘GPU 0’ (or whichever GPU entry the system shows) to open the statistics view.
- Step 4: The right panel displays real-time graphs for each GPU engine: 3D, Copy, Video Encode, and Video Decode – all showing usage percentages as activity happens.
- Step 5: Below the graphs, key statistics appear at a glance. This includes Utilisation percentage, GPU Memory (total across shared and dedicated), Dedicated GPU memory (for example, 1.0/4.0 GB on a 4 GB VRAM card), Shared GPU memory (for example, 0.2/15.9 GB), Temperature (such as 49 degrees Celsius at idle), Driver version, Driver date, DirectX version, and Physical location on the PCIe bus.
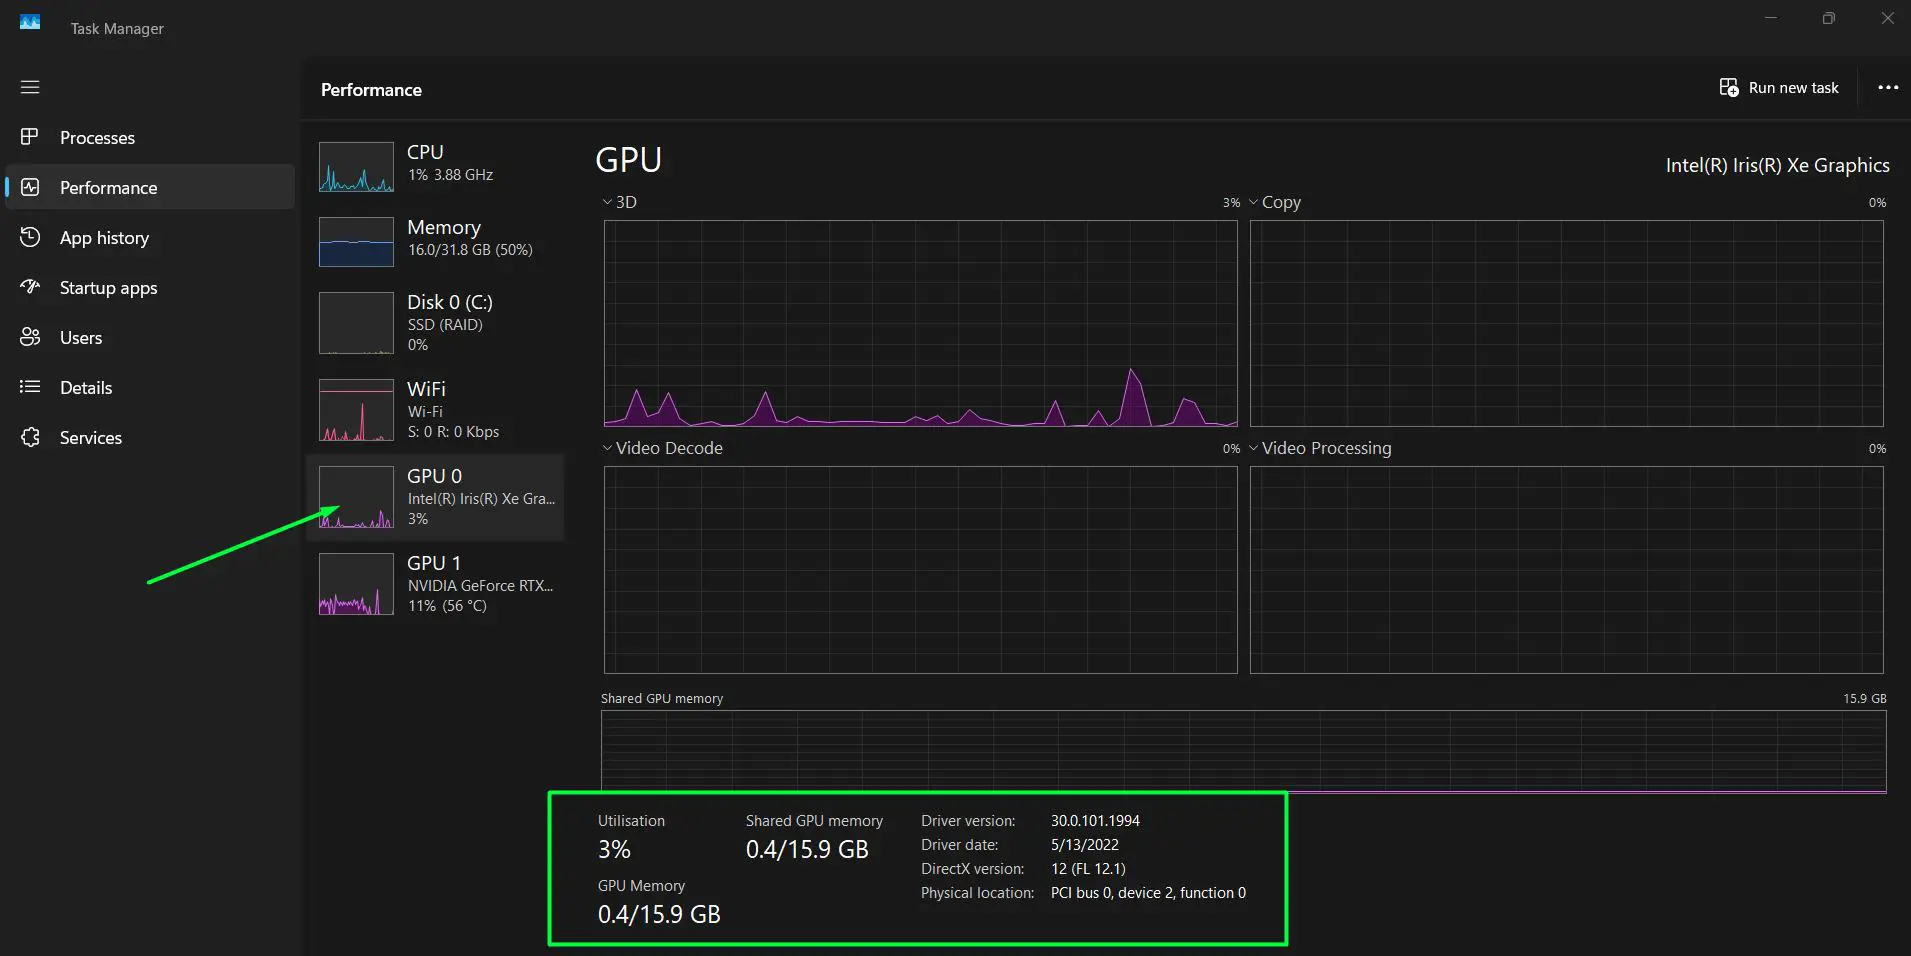
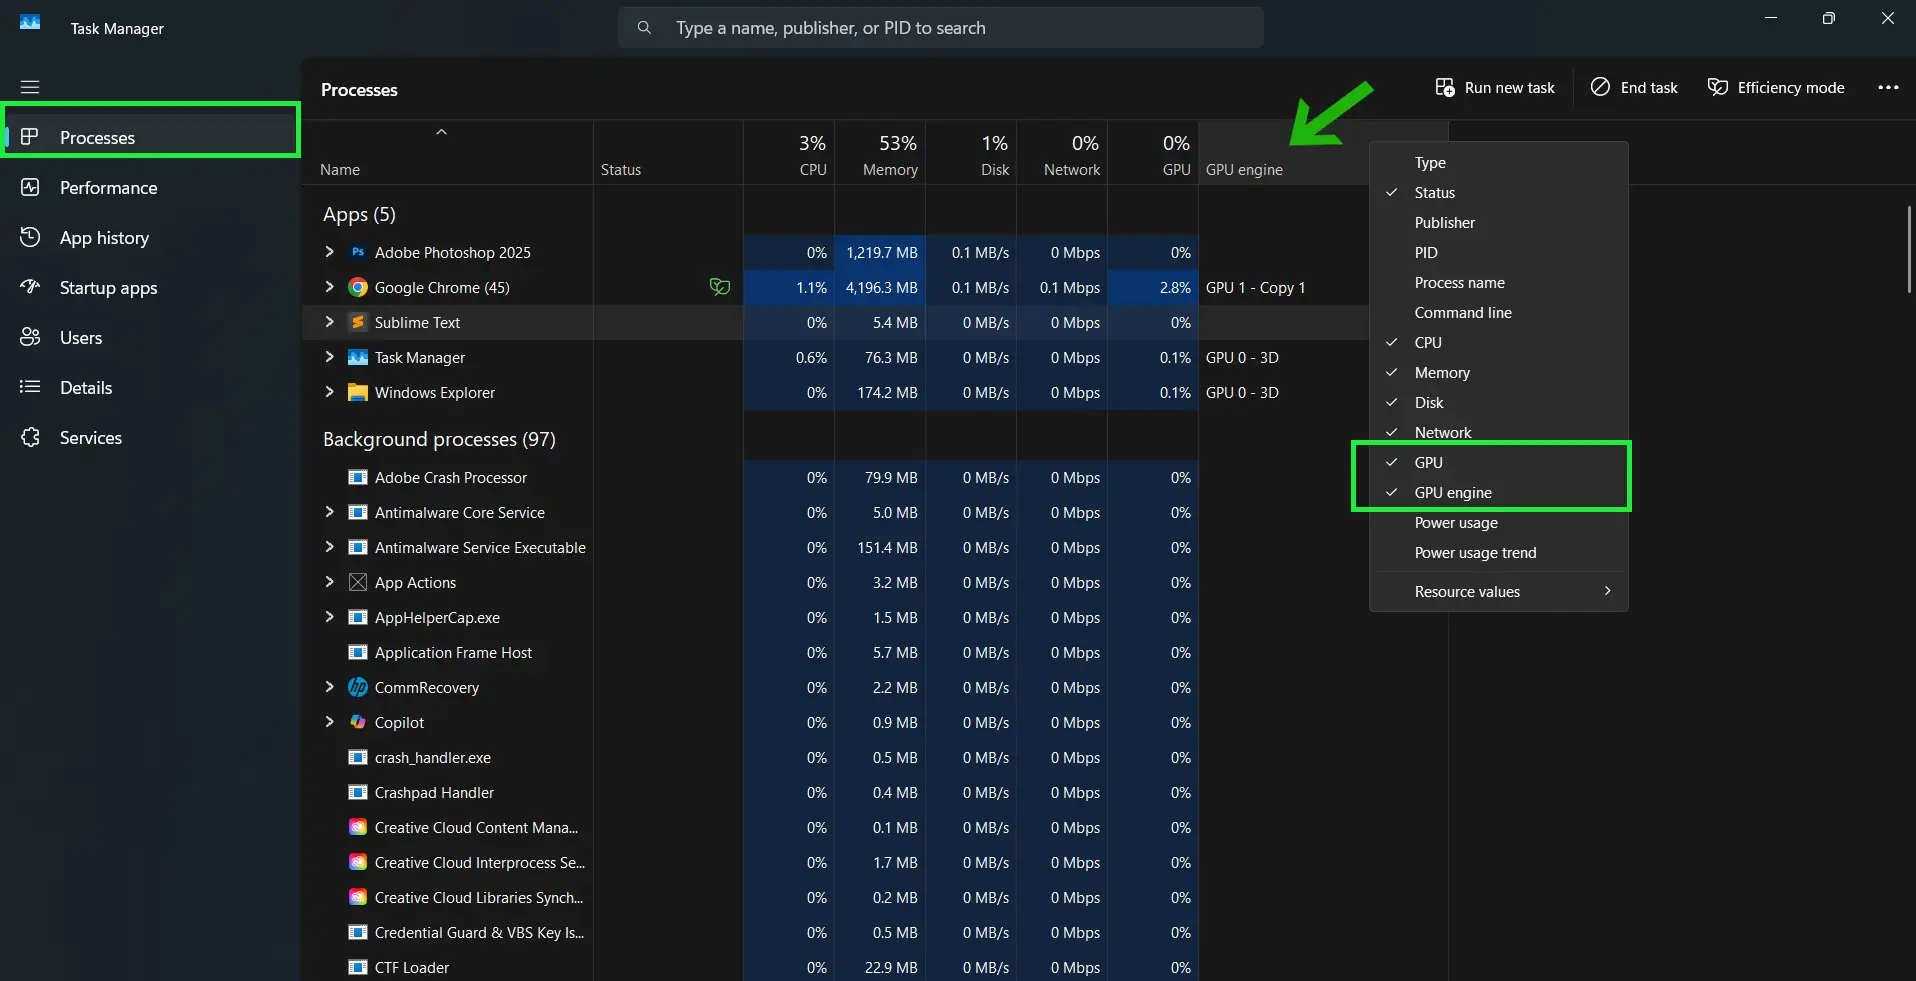
- Step 6: To see which specific apps consume GPU resources, go back to the ‘Processes’ tab, right-click any column header, and enable the ‘GPU’ and ‘GPU Engine’ columns.
This works best when running a quick diagnosis to confirm the GPU is actively handling a task or sitting idle.
On systems with NVIDIA graphics, the NVIDIA Control Panel lets users assign which GPU handles specific applications, which directly affects what usage numbers appear in Task Manager.
Method 2: Check GPU Statistics Using GPU-Z
GPU-Z is a lightweight utility that specialises in GPU information and real-time statistics. It goes much deeper than Task Manager, showing clock speeds, voltage, VRAM usage, temperature, and load per individual GPU engine. Anyone who wants detailed stats without a lot of complexity will find it very useful.
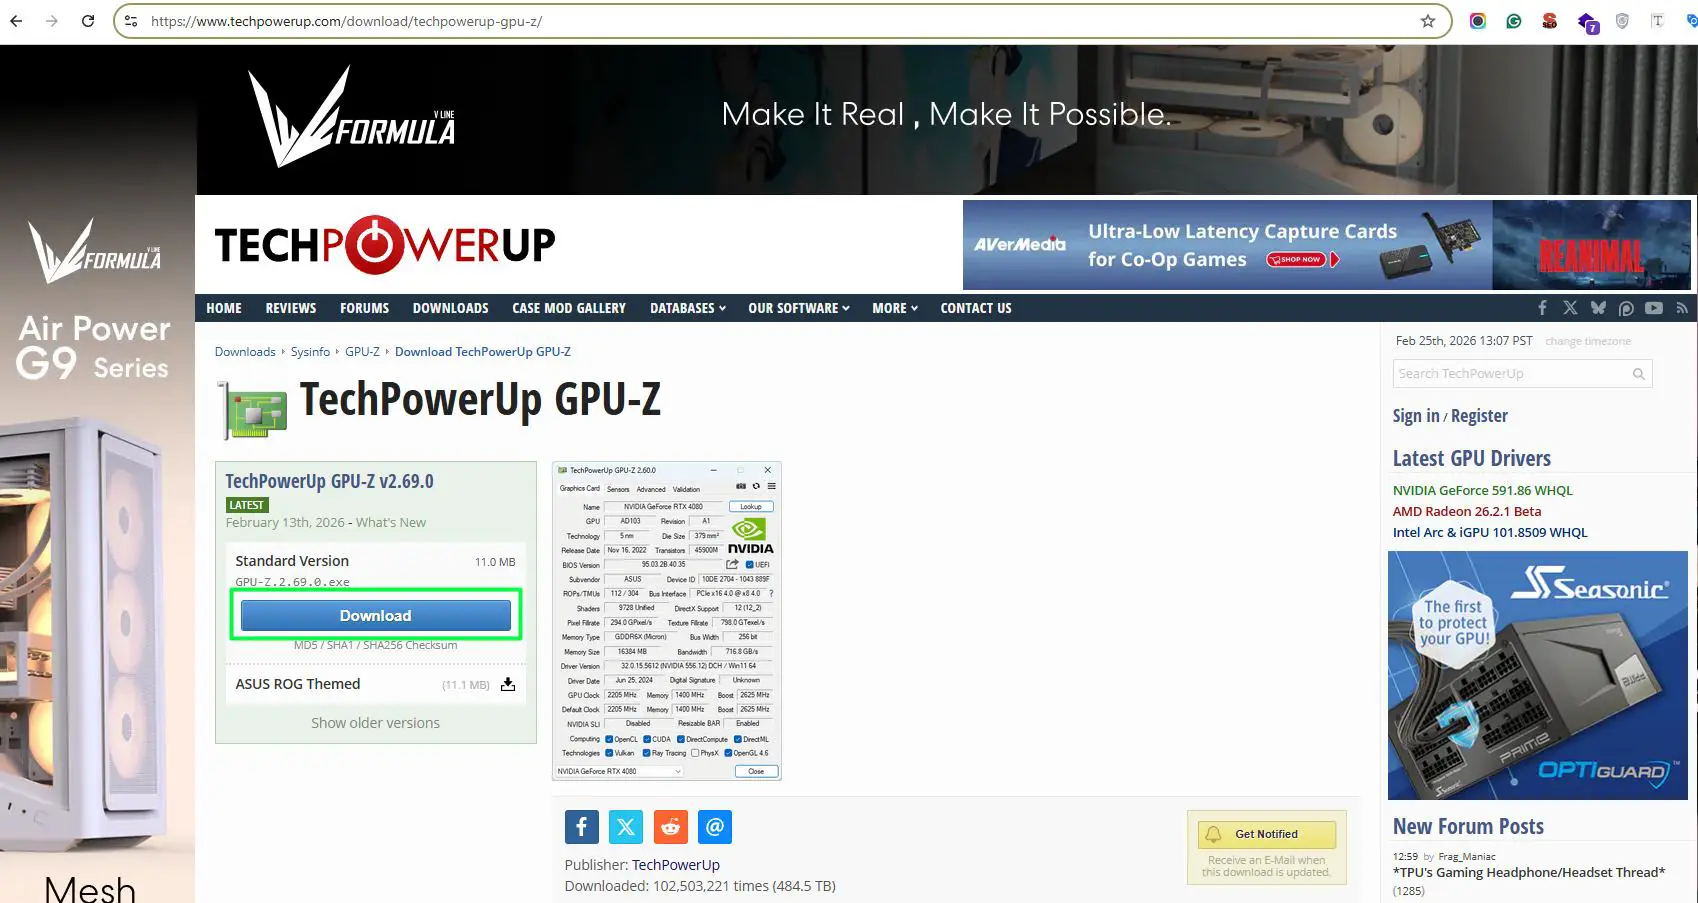
- Step 1: Download GPU-Z from the official TechPowerUp website. The download is free and the installer is small.
- Step 2: Run the installer and launch GPU-Z after installation finishes.
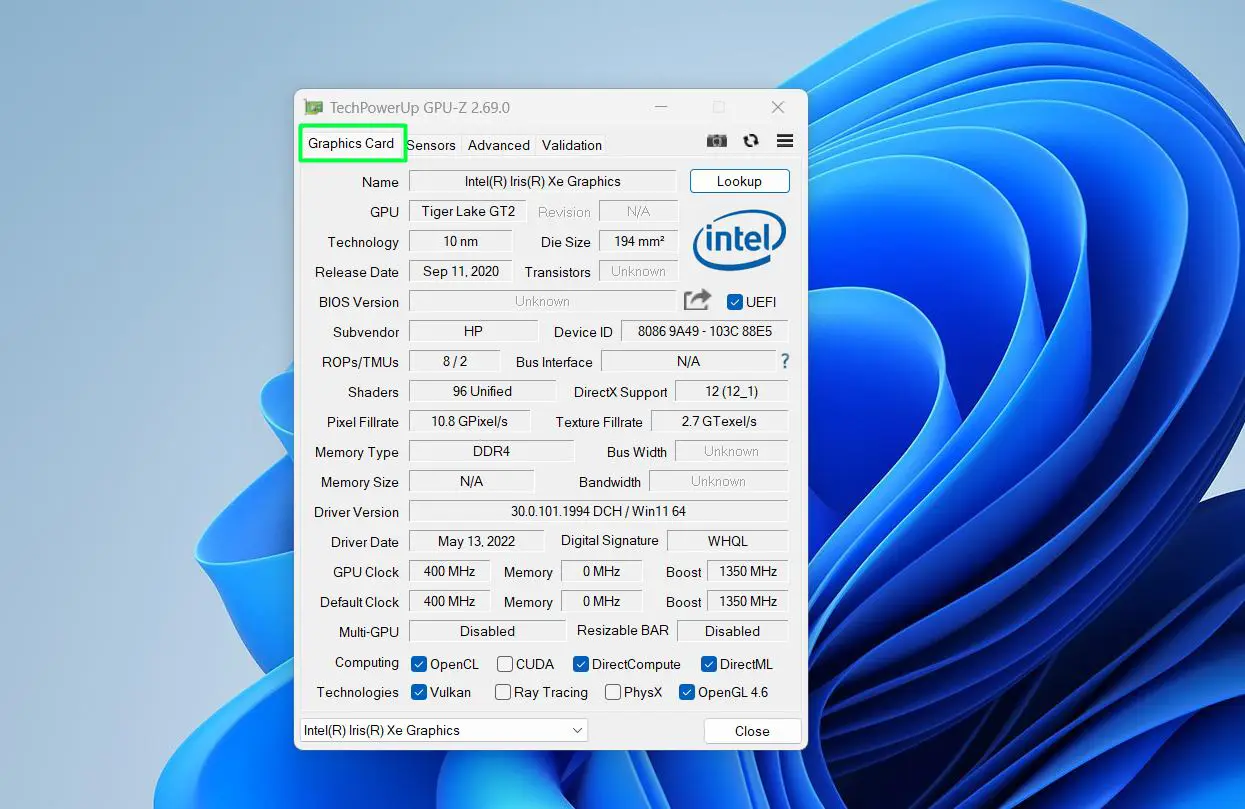
- Step 3: The main ‘Graphics Card’ tab lists full GPU specifications including the GPU name, memory type, bus width, and driver version.
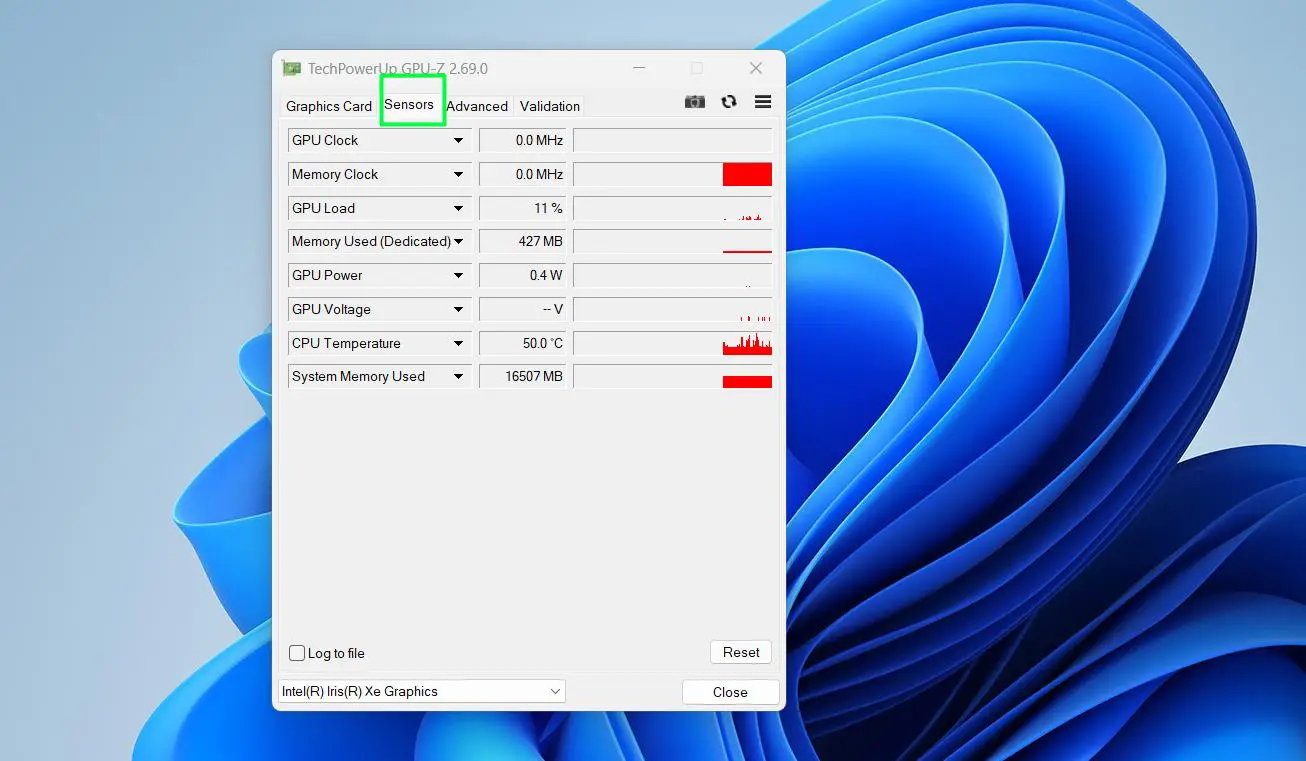
- Step 4: Click the ‘Sensors’ tab at the top of the window.
- Step 5: The Sensors tab delivers live readings for GPU Clock, Memory Clock, GPU Load, Memory Used (Dedicated), GPU Power, GPU Voltage, CPU Temperature, and System Memory Used – all updating in real time with a mini graph preview on the right side of each row.
- Step 6: To save sensor data over time, tick the ‘Log to file’ checkbox at the bottom left of the window. GPU-Z will write all sensor readings to a text file while it runs.
Pro-Tip: Run a game or benchmark first, then check the GPU-Z Sensors tab right after. The mini graph previews on each row show the activity spike history, making it easy to see peak GPU Load and Memory usage during that session.
Method 3: Monitor GPU Usage with MSI Afterburner
MSI Afterburner ranks as the most powerful free GPU monitoring tool available for Windows. It works with graphics cards from any brand – not just MSI. The standout feature is the on-screen display (OSD), which overlays GPU stats directly on top of games or any fullscreen app. Most gamers and content creators rely on this tool.
- Step 1: Download MSI Afterburner from the official MSI website. Install it along with the RivaTuner Statistics Server (RTSS) component when prompted, as RTSS powers the overlay feature.
- Step 2: Launch MSI Afterburner. The main window shows a live graph of GPU usage, temperature, and clock speeds by default.
- Step 3: To customise which stats appear, click the settings gear icon, then go to the ‘Monitoring’ tab.
- Step 4: In the monitoring list, find ‘GPU Usage’, ‘GPU Temperature’, ‘Memory Usage’, and any other desired stats. Click each one and check the ‘Show in On-Screen Display’ box at the bottom.
- Step 5: Click ‘Apply’ and then ‘OK’ to save the settings.
- Step 6: Launch any game or application. The GPU statistics now appear as an overlay in the corner of the screen, updating in real time.
Pro-Tip: Under the ‘Monitoring’ tab in MSI Afterburner settings, enabling ‘Log history to file’ saves GPU usage data to a text file. This makes it easy to review performance over a long session and spot exactly when usage spiked or dropped.
High background CPU or memory usage from unnecessary startup programs can also skew GPU readings. If the system feels sluggish even when GPU load looks low, it may be worth learning how to debloat Windows to free up resources and get cleaner performance data.
Tips for Monitoring GPU Usage Effectively
- Always monitor GPU usage while actively running the workload under test. An idle desktop will show very low usage, which does not reflect real performance.
- Watch VRAM usage alongside GPU core load. A GPU at 60% core load but 99% VRAM usage still faces a bottleneck.
- Temperature matters. A GPU running at 100% load above 90 degrees Celsius may throttle performance to protect itself.
- Compare GPU usage across different tasks – video encoding, gaming, and 3D rendering all produce very different usage patterns.
- For consistent results, close background apps before monitoring to reduce noise in the data.
Common Problems When Checking GPU Usage
GPU Does Not Appear in Task Manager
A missing or outdated GPU driver often causes this. Open Device Manager, find the Display Adapters section, and check whether the GPU appears without any warning icons. Updating or reinstalling the GPU driver usually resolves this.
GPU Usage Shows 0% Even During Gaming
This typically means the game or app runs on the integrated graphics chip instead of the dedicated GPU. Check the app’s graphics settings or go to Windows Settings > Display > Graphics and set the application to use the high-performance GPU.
MSI Afterburner Overlay Not Showing
Confirm that RivaTuner Statistics Server is running in the system tray. Without RTSS active, the overlay will not appear. Also check that the overlay is active inside Afterburner settings and that the application detection level in RTSS matches the target app.
GPU-Z Shows Incorrect or Missing Sensor Data
Certain GPU models or driver versions do not expose all sensor values. Running GPU-Z as administrator can fix missing sensor readings on some hardware configurations.
Frequently Asked Questions
What is the Quickest Way to Check GPU Usage?
What is the easiest way to check GPU usage in Windows 11?
The easiest way is through Task Manager. Press Ctrl + Shift + Esc, go to the Performance tab, and click on GPU. No extra software is needed and the stats update in real time.
Can GPU usage be checked without installing any software?
Yes. Task Manager in Windows 11 shows GPU usage, GPU memory, and per-engine load without any third-party tools. It already sits inside the operating system.
What GPU Stats Does Task Manager Show?
What is a normal GPU usage percentage during gaming?
During gaming, a GPU usage of 95% to 100% is actually ideal – it means the GPU is fully working and driving performance. Low GPU usage during gaming often points to a CPU bottleneck or a settings issue.
Does checking GPU usage slow down the PC?
No. Tools like Task Manager, GPU-Z, and MSI Afterburner consume a negligible amount of system resources. They run as lightweight monitors and do not impact gaming or workload performance in any meaningful way.
What is the difference between GPU usage and VRAM usage?
GPU usage reflects how much of the GPU processing cores are actively working. VRAM usage tracks how much of the GPU dedicated video memory holds textures, frame data, and other assets. Both matter and deserve attention together for a full picture of GPU performance.
Which tool is best for monitoring GPU usage while gaming?
MSI Afterburner with RivaTuner Statistics Server is the top choice for in-game monitoring. It displays GPU stats as an on-screen overlay without requiring an alt-tab out of the game.